Science
DNA logbook maps cells' developmental paths in mouse embryos
Using inherited DNA marks, researchers have linked cells' ancestry to what they become during early development in mice. The result is a reconstructed map of their developmental paths – not a film of the embryo's entire development.
3 min read
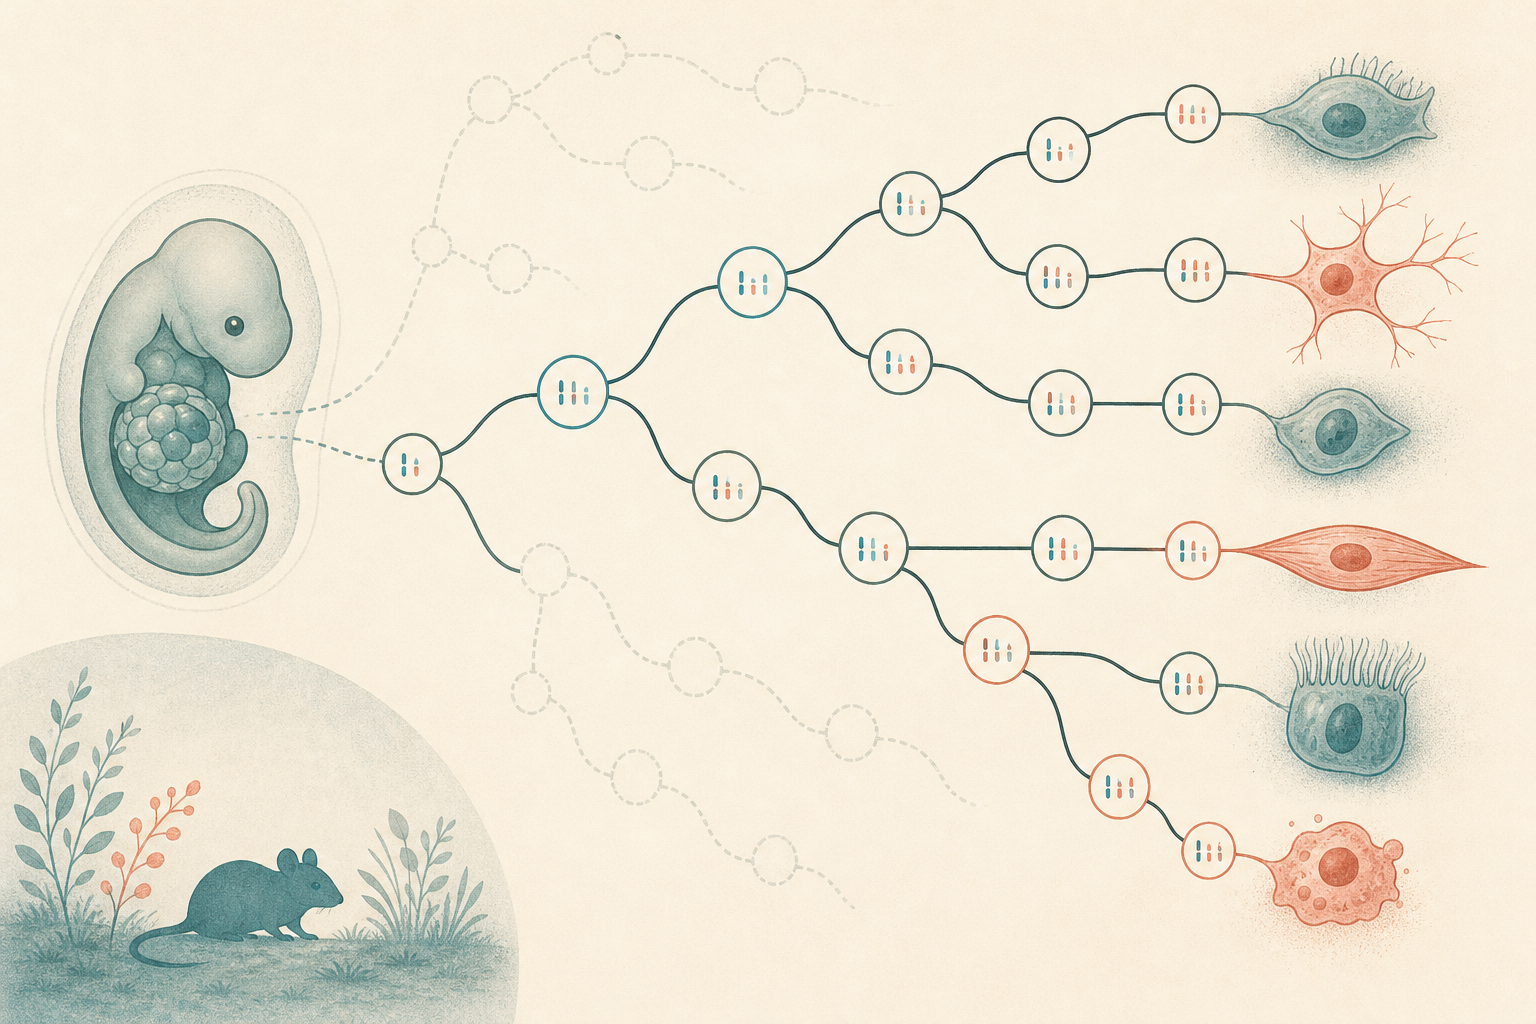
In a study published in Cell, researchers have reconstructed family trees for over 1.4 million cells from 16 mouse embryos. Combining those trees with information about the cells' gene activity makes it possible to investigate both which cells share ancestors and when their developmental paths diverge. This provides a map of how different cell types emerge during early embryonic development. [1] [2]
The technique, called PEtracer, continually adds small, heritable marks to cells' DNA. When a cell divides, its daughter cells inherit the marks, while further marks can accumulate. By reading the patterns later, researchers can infer which cells are related. MIT News compares the system to a flight recorder: information is recorded during development, but the history is reconstructed afterwards. [1] [2]
The experiments use genetically modified mouse embryonic stem cells, which were introduced into host embryos at an early stage. These donor cells and their descendants carry the genetic logbook. This is therefore not a case of filming every cell from a single fertilised egg throughout development. Different embryos were analysed at different time points. [2]
The cell atlas covers stages from roughly embryonic day 7.5 to 10, not the whole of development through to birth. Nor are the family trees complete: the authors estimate that they can distinguish around 75 per cent of cell divisions in the material analysed. That figure describes the resolution of the family trees, not how much of gestation has been mapped. [2]
The point of combining ancestry with gene activity is that they answer different questions. Gene activity helps researchers identify the type of cell they are examining. The DNA marks offer clues to how the cell got there. Together, the data are used to estimate when an ancestral cell's descendants begin to become restricted to particular developmental paths, and how many early cells contribute to a given tissue. [2]
Among the findings, the authors describe how the possible developmental paths of neural crest cells become progressively restricted. They have also inferred how different parts of the mesoderm, one of the embryo's early tissue layers, contribute to the cells lining blood vessels. In that analysis, origins are inferred from the family trees and the identities of closely related cells – the movement of each individual cell was not observed directly. [2]
The researchers also report strikingly similar patterns of ancestry across the embryos studied. Such recurring patterns matter if the map is to serve as a reference for how development usually unfolds. These are, however, comparisons within the same study, not an independent repetition of the experiments. [2]
One possible application is in stem cell research. MIT highlights that a map of the sequence of cell states could help researchers trying to turn stem cells into specific mature cell types. But describing a developmental path in a mouse embryo is not the same as being able to recreate it in culture. The map can suggest steps for researchers to test – it does not, by itself, provide a ready-made recipe for directing cells. [1]